|
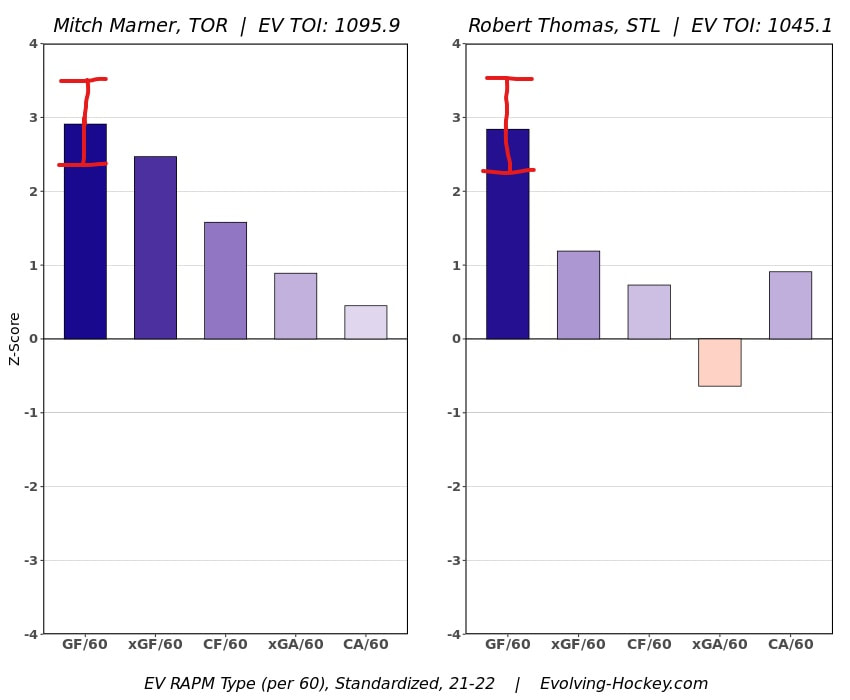
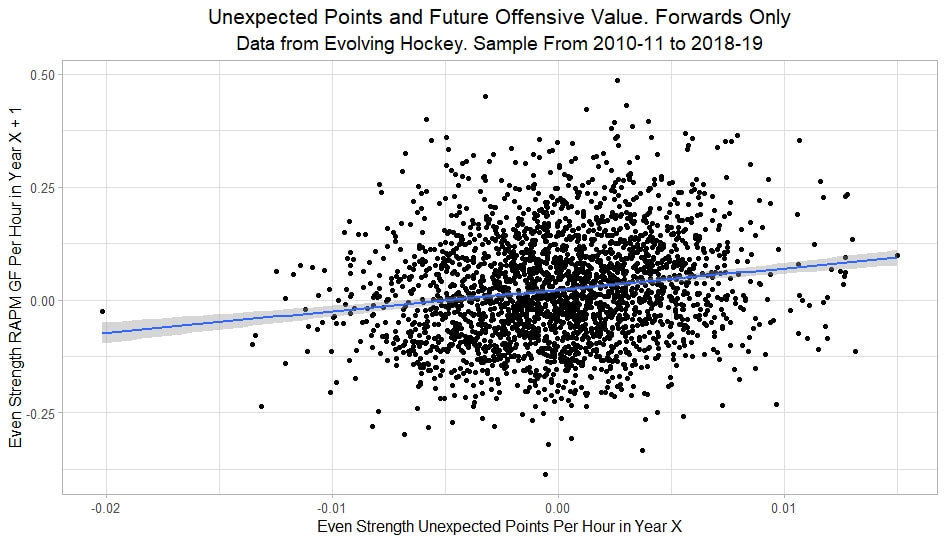
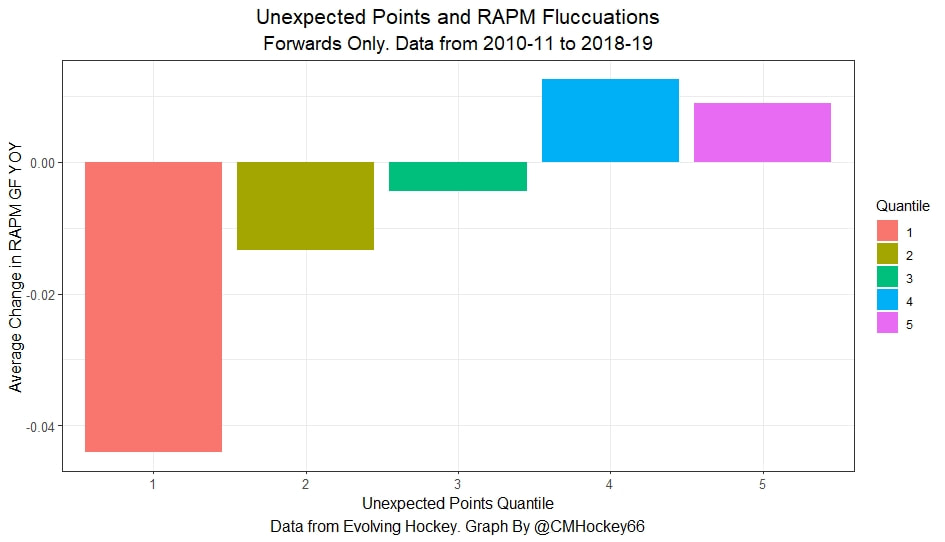
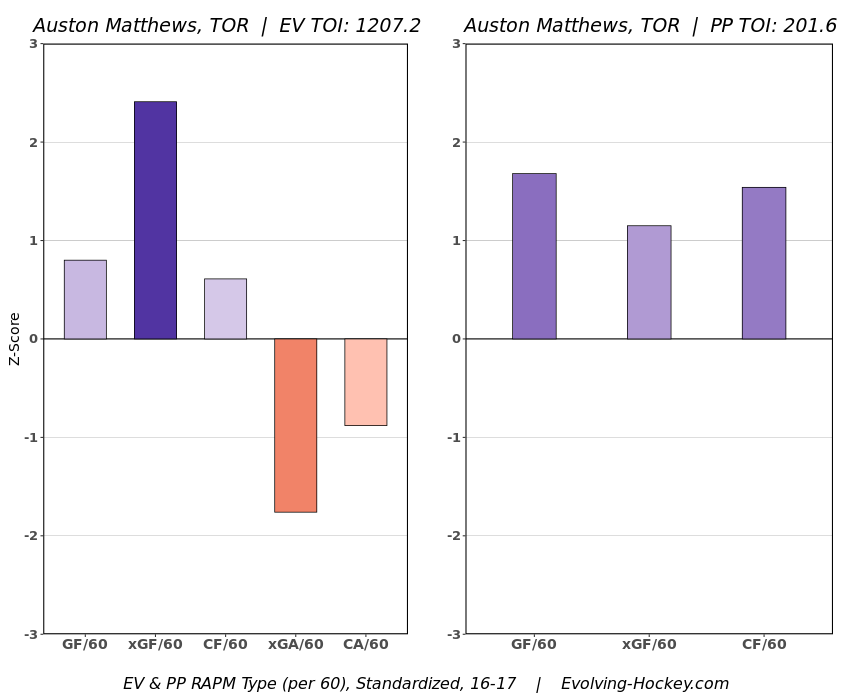
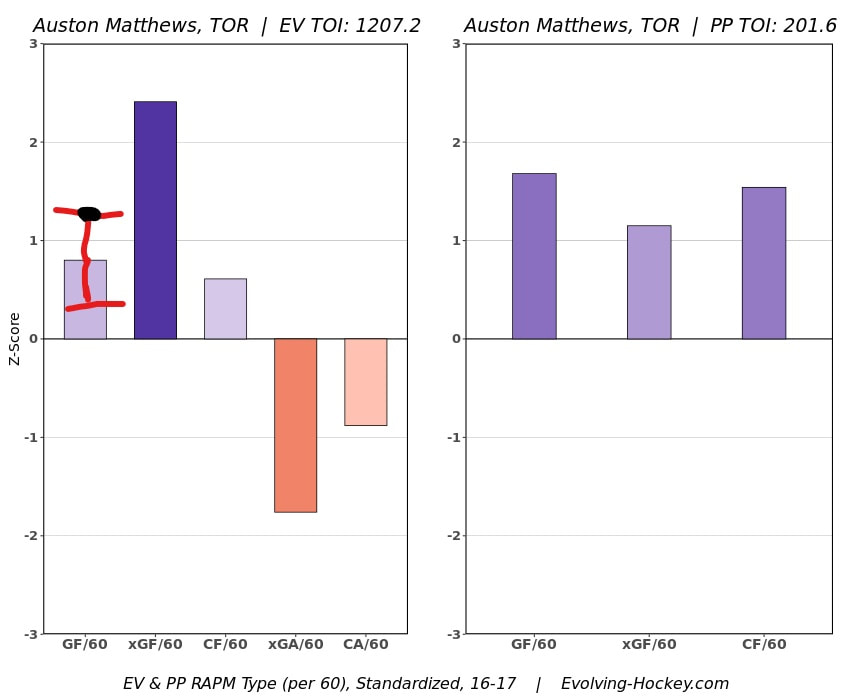
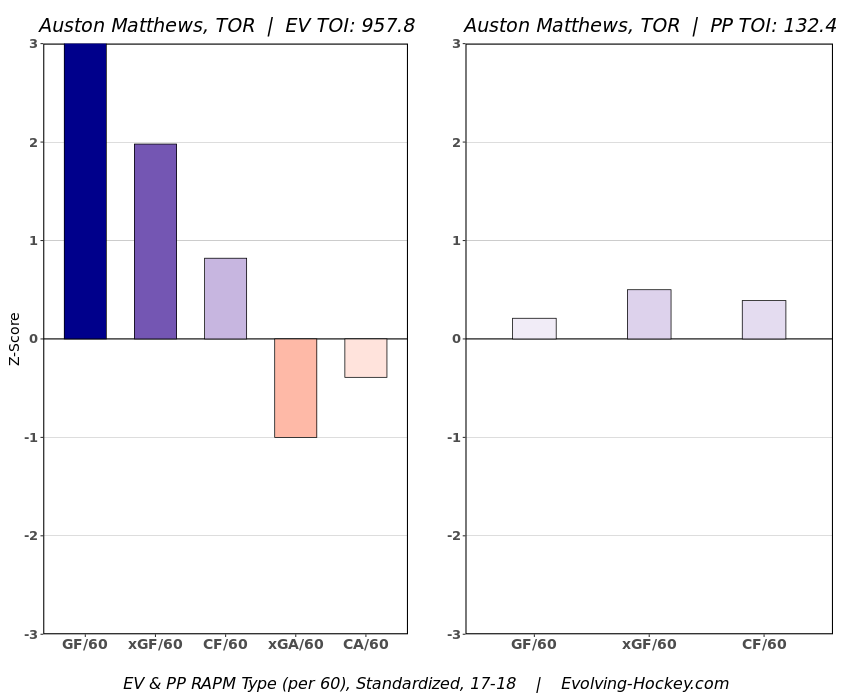
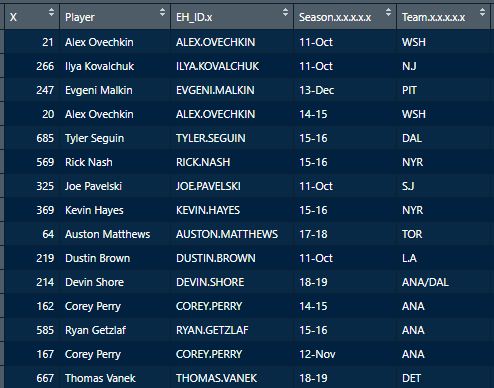
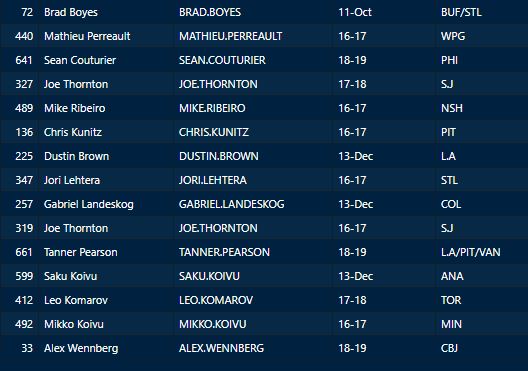
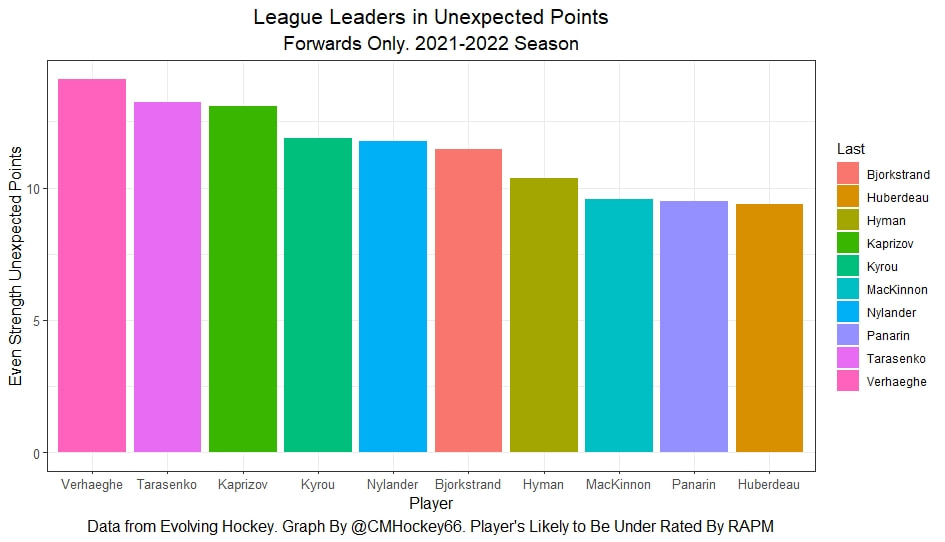
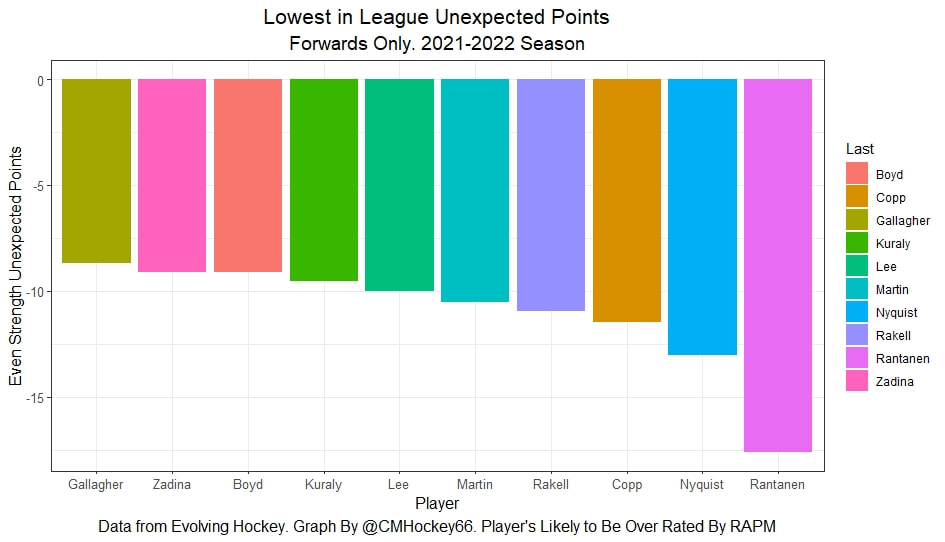
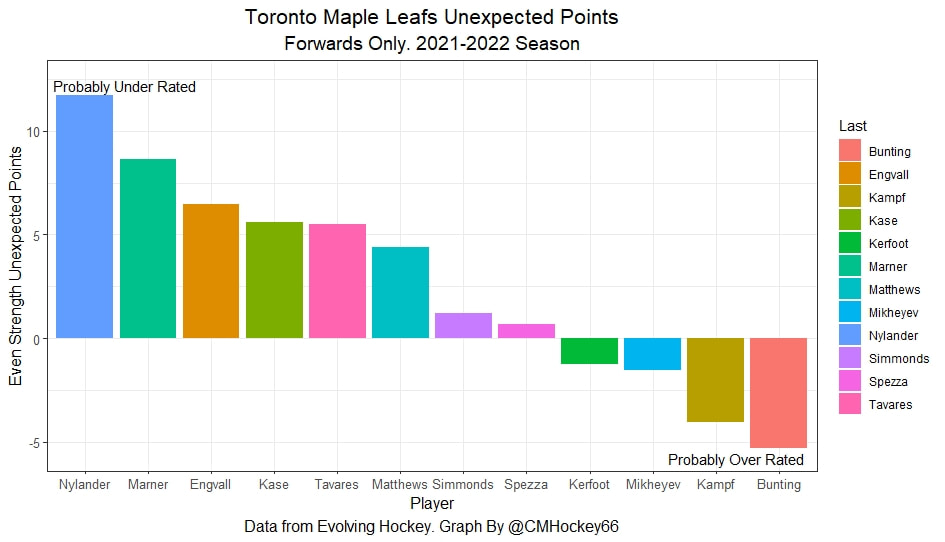
In a world where RAPM charts are easily accessible to everyone, points get dumped on a lot. There is some validity to this, points are probably over rated by everyone except hardcore member of the hockey analytics community. They are the general hockey fan's equivalent of a crutch perk. But I do think some people go too far the other way when talking about how useless points are in the modern NHL. Metrics like RAPM are better than points because they can account for various things like quality of teammate, competition, usage etc. (Note for this post I will be referring to RAPM goals for as the offensive target metric because scoring goals is the point of offence, but all of these things hold if you include RAPM xGF in the functions too. Also points is referring to primary points.) But, I still believe points have value in a world with better offensive evaluation metrics available, even independent of those metrics. Obviously points will always have value for their simplicity. They are highly correlated with better offensive metrics despite being much easier to digest. That fact alone will always make them valuable. But I think it goes beyond that, even if you know a players RAPM goals for impact, there is still signal of player talent in points, despite the metrics shortcomings, especially in the short run. Today I will use one of my favorite statistical tricks to show how, while introducing what I call "Unexpected Points". The first thing to understand with my logic is that all metrics that use statistical techniques have "error bars" even if you can't see them. A metric like RAPM cannot make them explicitly visible because of the penalization in ridge regression, but they are there. So when you see an RAPM chart, you should probably think of it like this. Marner technically had a higher RAPM Goals for impact than Thomas, but imagine a confidence interval around that value. Something like what I have beautifully painted in red. Within our imaginary intervals, we shouldn't be very confident that any player was significantly more valuable than anyone else. This is where points come in. An RAPM like metric is the best starting point, but when comparing players with similar impacts points helps show exactly where in that interval the player is more likely to fall. I believe this probably makes intuitive sense to hockey fans familiar with all the jargon I have just used, but let's see what I mean statistically. To do this, let's look at year over year correlations of the various metrics we are talking about. RAPM Goals for predicts itself well year over year. But, if you want to predict RAPM goals for year over year, including both the players previous RAPM Goals for and points per hour will probably improve the model. Note the target variable in these regressions are year x plus 1 RAPM GF at evens, with year x RAPM GF at evens and then primary points per hour as the predictors. Additionally, player's had to have at least 500 minutes in back to back seasons to be included in any of the analyses going forward The fact that points has predictive signal for the best publicly available offensive value proxy we have even when holding that metric's past value constant suggests to me there is still signal in points beyond RAPM. If you want to know who is going to be good? You are best off using RAPM and points. So there is clearly something about points that has value even in a world with better offensive metrics. So how exactly to find that signal? It's not as simple as just grabbing points data, because points and RAPM goals for are strongly related. So if you just take the two variables at face value you will do a lot of double counting. As a result, it's not quite as simple as saying look this guy has a good points per 60 and RAPM impacts. A regression will do the trick of weighing the two, but there are a couple problems here. 1) Most people aren't going to go run their own regressions 2) Even with a regression model's output, it won't be obvious which part of the value is from point production So, to find the signal in points, we are going to generate a variable I call unexpected points. This is the result of an equation where unexpected points is the U (residual / error term) in the following function. Points Per Hour = Some Constant + RAPM Goal For Per Hour + U Statistically, the U term here shows the part of a players point production that cannot be explained by RAPM. Technically, the independent variation in their points per hour, which is why I call it unexpected points. This way we can look at points without double counting already available information that is generally superior. Unexpected points helps predict future RAPM success. Showing us that even if you take out all the information also contained in RAPM Goals for numbers, points still have value. Another way, I grouped players unexpected points into 5 quantiles. The bottom 20% of players in terms of unexpected points were in the first group, then the players in the 2o-40th percentile were in the second etc. Here is how players RAPM goals for values changed year over year based on their quartile. Generally, players who had below average unexpected points totals saw their RAPM values decline, while above average unexpected point producers saw their RAPM goals for increase. The relationship is most extreme at the bottom where players with the lowest values of unexpected points per hour saw sharp declines in their RAPM Goals for estimates, on average. This is despite the fact by definition unexpected points is completely uncorrelated with RAPM goals for. To me, this shows that unexpected points probably helps show us where a player's RAPM goals for impact is within those error bars mentioned above. Let's take a great past example and illustrate it. One of the top seasons by unexpected points in my dataset was Auston Matthews rookie season in 2016-17. Here is what his RAPM chart looked like after that season. But using our knowledge of his incredibly high unexpected points value and that RAPM has error bars, we can guess Matthews true value was probably closer to the black dot on our imaginary confidence interval than his actual RAPM GF estimate. The next season, Matthews offensive value shot through the roof. This was of course partially due to age / natural progression, but part of this increase was because that using unexpected points, we would have been able to wager he was probably already a better offensive player than his RAPM value suggested. So generally, if two players have a similar RAPM GF impact, the one with more points is more likely to be better next year, which suggests he was probably better this season too. Especially because the target variable in hockey (goals) is so noisy, if two players were equally as good descriptively, the one whose predictive numbers (ignoring age) are better, was probably actually better that season too. This helps us sort through RAPM values and help show where in the imaginary confidence interval players are likely to sit. The metric also passes the smell test, for whatever that is worth. Here are the top 10 and bottom 10 seasons per my values. Note the season variable is a little wonky, it actually represents the season after. So if a value says 16-17, it's the players 15-16 season with the high unexpected points value. Here are the top seasons in unexpected points. Also ignore excel's stunning ability to misread numbers as date for some of the seasons. And then the bottom. I know which names I think are more likely to be towards the top of the imaginary error bars. The names seem to generally make sense. 2022 Offseason Finally, let's use unexpected points to find some players likely to be over valued by RAPM charts this offseason. Let's start with some of the most potential under rated forwards. A few interesting names here. People have used RAPM to dunk on those in awe of Panarin and Huberdeau's season so it's interesting they are in the top 10 here. Huberdeau still likely wouldn't deserve MVP love, but it adds some nuance to the conversation at least. And then for the over rated forwards. Hardcore nerds may know that Mikko Rantanen got a lot of "credit" this year while Mackinnon got less than expected, even though Mackinnon is generally considered better and this metric may help us explain why. Mackinnon's value was probably under rated and Rantanen was likely the primary beneficiary. Another notable name to me is Jesse Puljujarvi, who ranked 12th last. Public analysts, admittedly including myself, seem to be much higher on than the rest of the league. Maybe this might explain why the statistics we generally use to define success are so out of sync with his league wide trade value. For fun, here are the Toronto forwards ranked by this metric this past season. Bunting was great this year but him being atop Toronto's "most over rated by RAPM GF" list makes all the sense in the world to me. There is pretty much no way his true impact this season was anywhere near his 4+ standard deviation from the mean estimate. Especially given Marner's name on the probably under rated by RAPM list, now we can guess exactly who Bunting took the credit from in the model.
So that's unexpected points. How to make an obsolete statistic useful again in 2022. Many of these relationships like Marner likely having some of his value given to Bunting seemed intuitively true, so it's interesting it happens statistically too. I will be posting the data publicly at some point so check my Twitter for that!
2 Comments
Cam
6/17/2022 07:27:41 pm
This was great! Really enjoyed :)
Reply
Leave a Reply. |
AuthorChace- Shooters Shoot Archives
November 2021
Categories |

 RSS Feed
