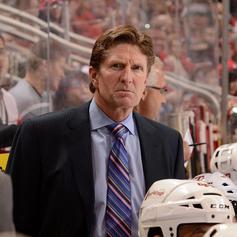
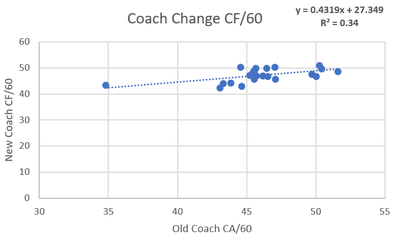
 A question I have always had is what impact coaches actually have on NHL teams. Usually, their impact is simply mentioned anecdotally with nothing actually backing anything up other than winning records. I used to never think coaching impact would be high, but the 2015-16 season made me rethink this theory. In this season these two teams were possibly the most extreme case studies of the impact a coach can have. First, there was Babcock and the Leafs. In 2014-15 season Toronto a 46.32% Corsi under coaches Randy Carlyle and Peter Horachek, good enough for fourth last in the league. But then that summer they landed the biggest coaching fish Mike Babcock and skyrocketed up to a 50.59% Corsi, good enough league average (despite bleeding talent that summer and throughout the season). Early in that same season, the Penguins were in a tailspin like the lite version of the 2014-15 Leafs. Crosby wasn't scoring, and the team was a disappointing fifth in the metropolitan division. This was not simply luck as the star-powered team only had a 48.34% Corsi. But then it all changed when they Fired Mike Johnston in favor of their AHL coach Mike Sullivan. Under Sullivan, they lit the league on fire running the table with a 55% Corsi en route to their first of back to back Stanley Cups. Ever since watching both these dramatic swings it seemed to me like the coach could be even more valuable than the players on these teams. So these coach MVP's left me asking one question, how much impacts do coaches really have on shot rates? Method The method I used was fairly simple. First off teams were all put into two sides with year X on the first side and Year X+1 right beside it. For example, the 2012-13 Penguins went on the left side and they would be compared to the 2013-14 Penguins on the right. This way we could look at how teams shot rates changed from season to season. The next step was to attempt to isolate the variable that was coaches. This was done by taking all these teams and binning them into 3 categories. The first category was teams that made midseason coaching changes, these teams were removed from the data. For example, because the 2014-15 Leafs fired Carlyle for Horacheck, the 14-15 vs. 15-16 data for Toronto was not included. There are already a lot of moving parts when using this method to compare Babcock to his predecessors so including data with a third coach seemed to be unnecessarily adding another extraneous variable. Next there are the two bins actually used, first was the same coach category. This was teams having the same coach for the year of X, plus the year after that. For example, the 15-16/16-17 Hurricanes used Bill Peters for the entirety of two seasons and therefore were in this bin. The second bin represented the "Coach Change" bin, and it was a team which used two different coaches for the entirety of two different seasons. For example, in the summer of 2016 the Anaheim Ducks fired Bruce Boudreau and hired Randy Carlyle, so the Ducks 2015-16 data was compared against the 2016-17 data in this bin which examined the effects of a coaching change. From there we can examine how shot rates change from year to year for both same coach teams and coaching change teams, and infer that the difference is probably largely related to coaching. This results in the binds being 99 same coach teams since 2011-12 and 22 summer coach change teams to work with. Now that there is a method, let's see how they differed. (Data from Corsica.Hockey) 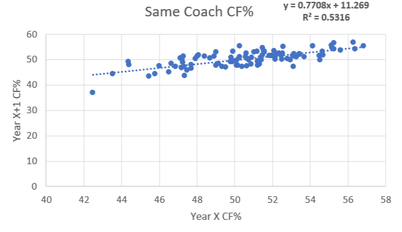 Repeat-ability of CF% With Same Coach First off let's see the teams who remained the same and how their shot rates compared year to year. To see what the relationship is simply creating a scatter plot of the data and see what the correlation was. To the left is the results of that process. A glance at the R^2 shows us a correlation of 0.53. What this means is there is a moderately high relationship between an NHL teams who have the same coach in back to back years CF%. This seems logical. While they're always moving parts but teams generally don't change enough on a year to year basis to make a huge swing in CF%. Using the equation of the line of best fit there is also another interesting thing I found. If you sub 50 in for X in the equation y=0.7708x+11.269 you get a value of 49.809. What this means is that teams who stick with their coach actually get tend to get worse the next year. This is probably just regression to the mean however maybe the whole "Coaches voices go stale voice narrative" may actually have a little bit of truth to it. So now that we know how teams who keep their coaches results fluctuate let's compare them to teams who change their coach fair and compare. 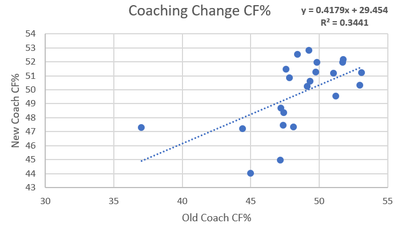 Repeat-ability of CF% with Different Coaches Before we begin it should be noted that the coach change bin is much smaller, with only 22 teams so that could increase noise. With that in mind it's time to examine the new coach bin. The difference is substantial compared to the same coach graph and you can see it at first glance. The R^2 shows us a correlation of 0.34. This means there is almost no relationship between year to year CF% a mung teams that changed coaches between said seasons. From here we can take the difference between the two (0.53-0.34) which gives us 0.19. This means that teams who change coaches in the off season's CF% are 19% more variance than those who keep the same coach for two years. From here I make the cautious conclusion that coaching can be responsible for up to 19% of the variance in a teams CF%. Also from this line of best fit there is another interesting observation. When you sub 50 in for X in the equation of y=0.4179+29.454 you get a y of 50.349. This means that teams that fired their coaches actually saw their shot rates improve next year. Again this is probably just regression to the mean but i thought it was interesting. So now that we can estimate the fact that coaches are responsible for nearly a fifth of a teams shot rates, lets look at what specifically changes. 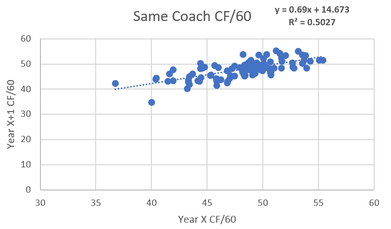 Coaching Impact on Shot Generation Now that we can see the impact coaches have on Corsi For Percentage, now we can look more specifically at what side of the puck coaches seem to influence more. This can be done using the same simple method of above but just splitting into two bins, Corsi For Per 60 minutes and Corsi against per 60 minutes. First, lets look at shot generation with the control group (same coach) to the left. The repeatably gives us an R^2 of 0.5027, slightly less repeatable than overall CF%. Now that we know how repeatable offense is a mung same coach teams, let's see how they stack up relative to coaching changes and estimate their impact from there.
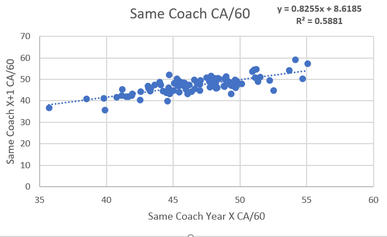 Coaching Impact on Shot Suppression Hockey coaches are infamous for putting way too much emphasis on the defensive side of the puck. Seemingly every team has a horror story of the coach not playing a gifted offensive player enough because of perceived defensive weakness. We are about to see that there is a reason for this. To the left, we can see the repeatability of shot suppression a mung same coach teams. The R^2 is 0.5881 which is the strongest relationship yet. The R^2 is 0.08 larger in this sample than the shot generation sample. 8% Less noise in the shot suppression sample is a strong clue that coaches may have a larger impact on defense than offense, but to be sure we can use the same test as used above. 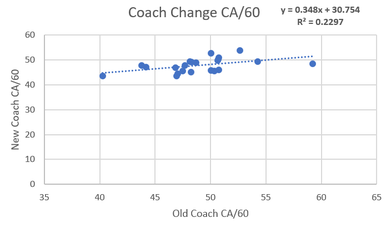 To the left is the sample where teams had a coaching change and the R^2 comes out as 0.2297. This means that there really isn't a relationship in the year to year shot suppression from teams that changed coaches. One last time we can take the same coach R^2 minus the coach change R^2 (0.5881-0.2297) and we get a value of 0.3584. This would appear to mean that coaches can be responsible for up to 35% of shot suppression. The fact that up to a third of a teams defense (when it's defined as shot suppression) are simply the results of the teams' coach is an impressively high number. I would wager that very few, if any single players have such a massive sway on teams shot rates. So bringing this back to a point made above this could illustrate why coaches seem to love defense so much. It appears they have twice the impact on what happens without the puck rather than with it. Knowing this it makes intuitive sense that they focus on defense so much as it could be a result of either focusing on what you control or a choice support bias. Trying to figure out which one leads to a sort of chicken vs. the egg kind of debate. This depending on whether you think coaches focus on defense because they can control it or control defense because they chose to focus on it, but the point remains that coaches can drive as much as 16% of shot generation, and 35% of shot suppression. So since such a large portion of shot rates are can be driven by coaches me think that coaches are maybe the most underrated part of hockey teams on-ice results.
0 Comments
|
AuthorChace- Shooters Shoot Archives
November 2021
Categories |
 RSS Feed
