|
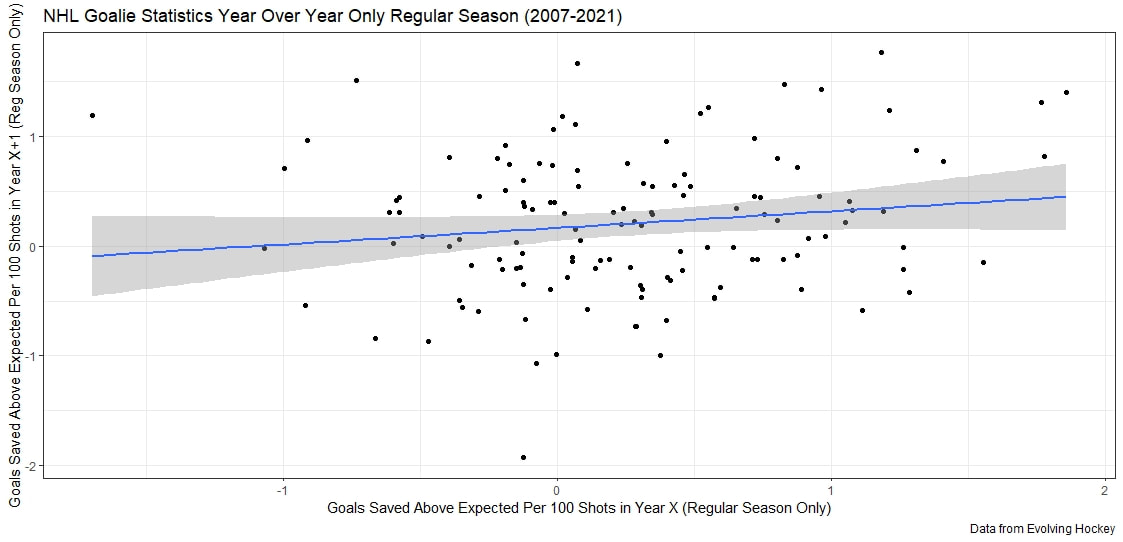
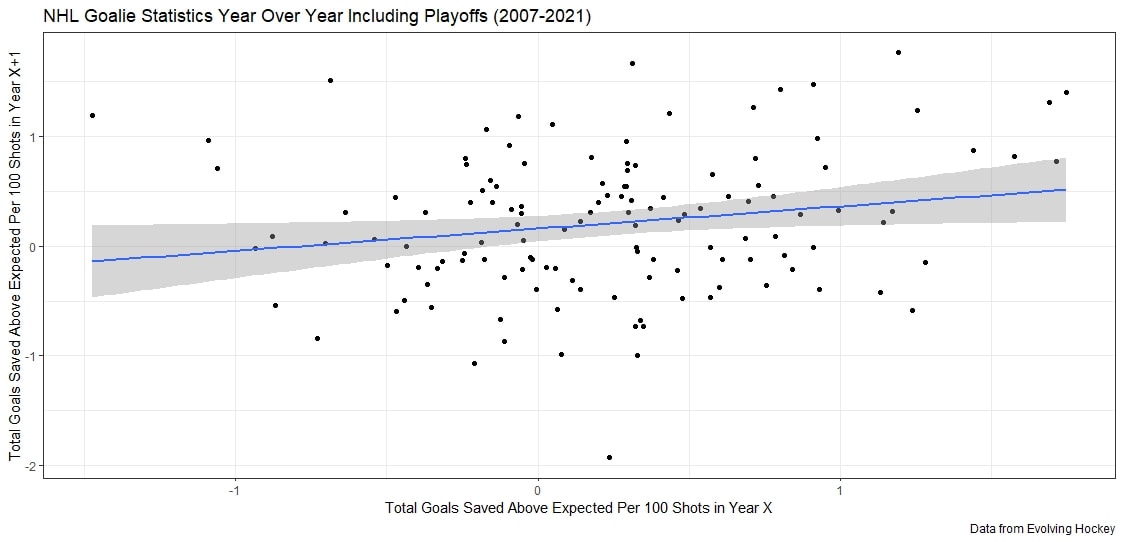
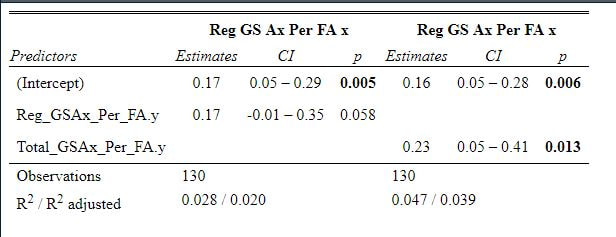
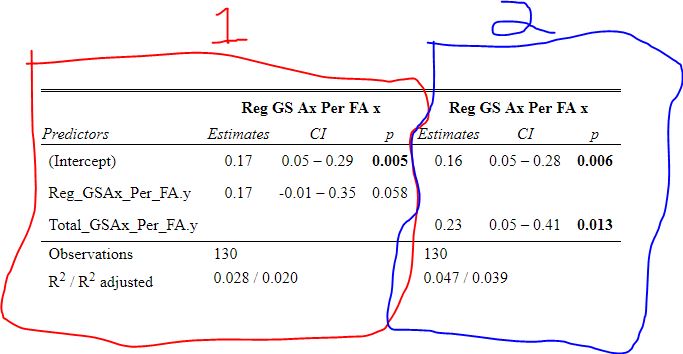
Any hockey analytics nerd will tell you goalies are the worst. Nobody, numbers nerd or scout, can be nearly as confident with goaltender evaluations as with skaters because their numbers are almost completely random from game to game, month to month, and season to season. Guys will win the Vezina and suck literally one year later. It is generally believed that the reason why is the sample size. The only thing we can evaluate goalies on is how often the puck goes in the net. The problem is, the puck only goes in the net like 10% of the time. If only had goal differential to evaluate skaters, we would run into similar problems, especially defensively. This got me thinking if the sample size is the problem, why do we artificially restrict the sample size we use when evaluating goalies? People tend to only look at regular season results when analyzing goaltenders (or anyone in hockey for that matter). As a result, hundreds of games and thousands of data points are thrown out before we even begin to evaluate goaltenders. Then once we are done analyzing them, we turn around and complain about how we need a bigger sample size. I don't think the noise will ever be close to eliminated, even with tracking data from the next century, but I think a relatively simple trick can help us forecast goaltender performance. My idea is why don't we start including playoff results when evaluating goaltenders. More data should almost always be better, and it should be especially meaningful to help us with hockey's nosiest position, goalies. So, today let's see if including playoff statistics might help us forecast goalies. Adding Playoff Statistics for Goalies So, to test my theory the metric we are going to use is goals saved above expected per 100 Fenwicks (unblocked shot attempts) against. (Statistics from evolving hockey). We are going to compare the same set of goalies using this same statistic, just calculate 2 different ways. Once with only regular-season results, and once with regular-season and playoff results combined. Note that the set of goalies will be those who played in both the regular season and playoffs since 2007-08. Additionally, those goalies will need to have faced at least 750 Fenwicks against in both season X and X+1 (the season after whatever year is in question) to be included. With the sample of goalies defined we get 130 goalies. From there we will look at how well both numbers predict goals saved above expected per 100 shots in the next regular season. If including playoff statistics does help us predict goaltending performance, the correlation to future results should be higher when including the playoff numbers as well. Was that the case? Well, let's find out. Again it may not look crazy to the naked eye, we actually see a relatively large improvement in how predictable a goalie's regular season results are when using playoff statistics too. This will be more obvious when looking at the regression tables below. These tables simply show the results of the two regressions visualized above. Model one is when a goalie's statistics in a given year were purely a function of his statistics in the previous regular season "Reg_GSAx_Per_FA.Y". Then there was a second model where his statistics in a given year were a function of his aggregate results from the previous season including both playoffs and regular-season games "Total_GSAx_Per_FA.y". Since that looks annoying to read, I enlisted some help from MS paint to help people group the models. In red, the first model is how to get the first graph. We see using only regular-season numbers, a goalie's previous season had no statistically significant relationship with their next season's results. In blue this regression is the output of the second graph. We see that the R squared nearly doubles when including playoff results too. Additionally, in the second method, there actually is a statistically significant relationship between a goalie's previous season's numbers and his regular-season output that year.
The TakeawayWhat we can learn from this is pretty simple. Goalies are weird and that is not a novel idea. Even using adjusted numbers a season of data on a goalie will generally tell you very little about what he is going to do in the future. So, if you are going to evaluate them in a predictive sense, include his playoff results if he has any. It will give you a better idea of what he is likely to do in the future with playoff numbers included, and it is a very simple idea. Goalies will always be noisy, but by including their playoff results we can increase the sample size and make slightly better predictions about their future. Finally, I should note I only did this test for one metric, but I am willing to bet it will be the same for other goalie statistics too. If you do end up testing other metrics using playoff data as I did, dm me @CMhockey66 and I'd love to see if the same is true for other metrics or the same metric but from a different model. Thanks for reading!
0 Comments
|
AuthorChace- Shooters Shoot Archives
November 2021
Categories |


 RSS Feed
