|
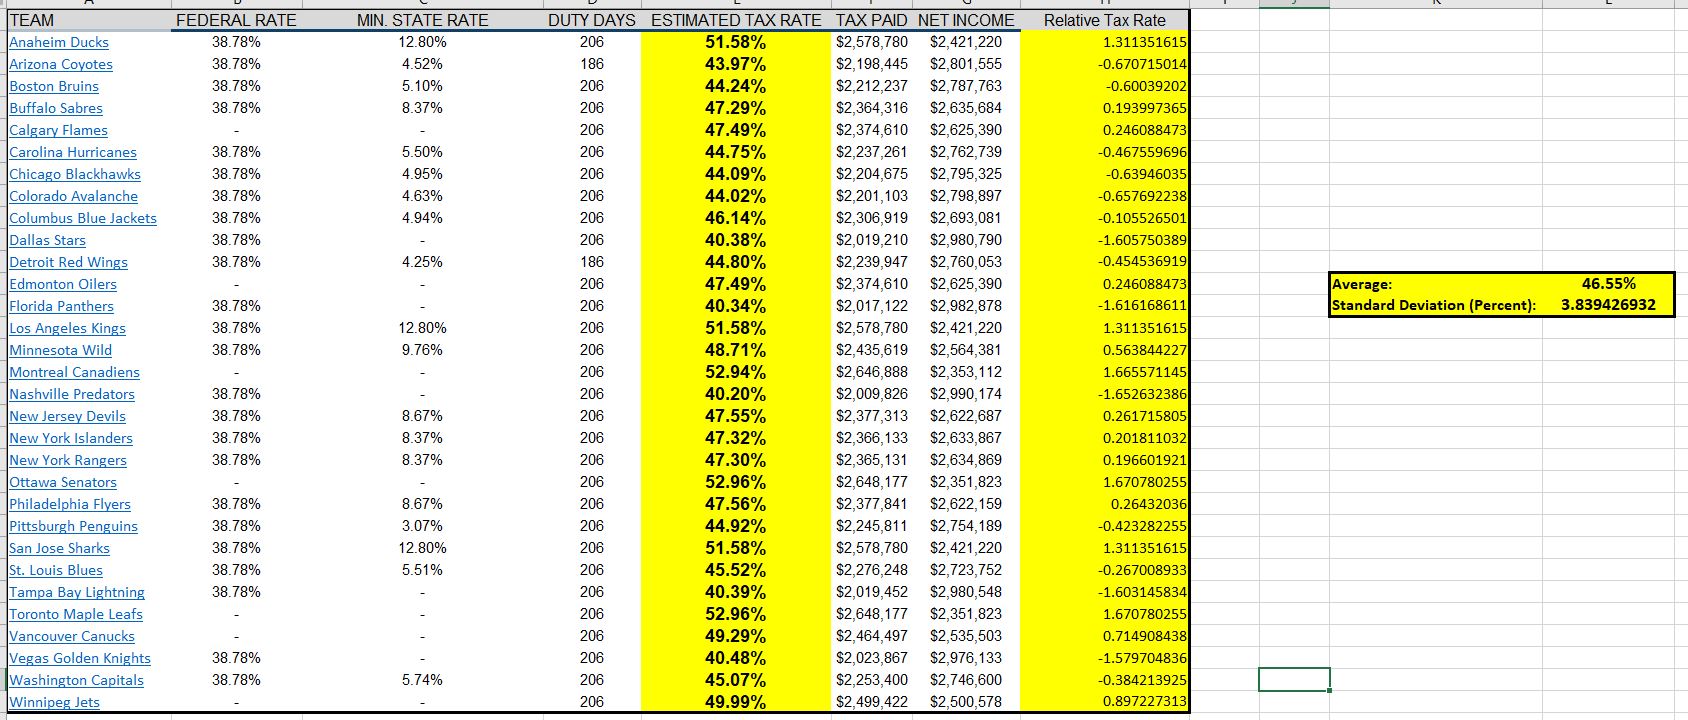
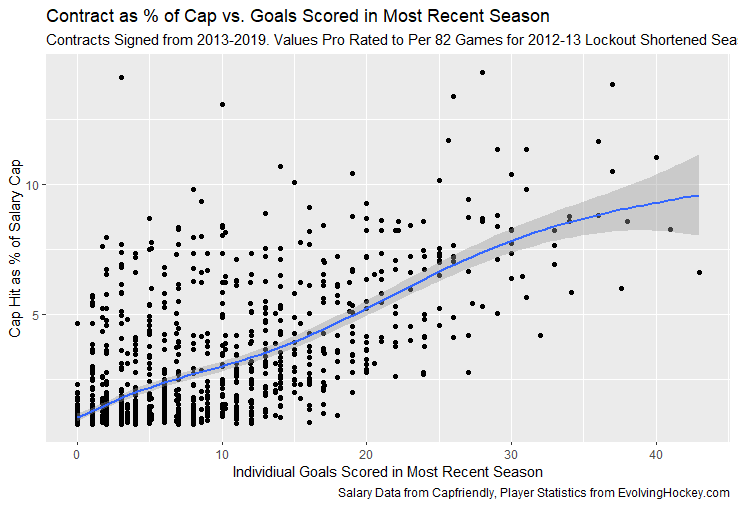
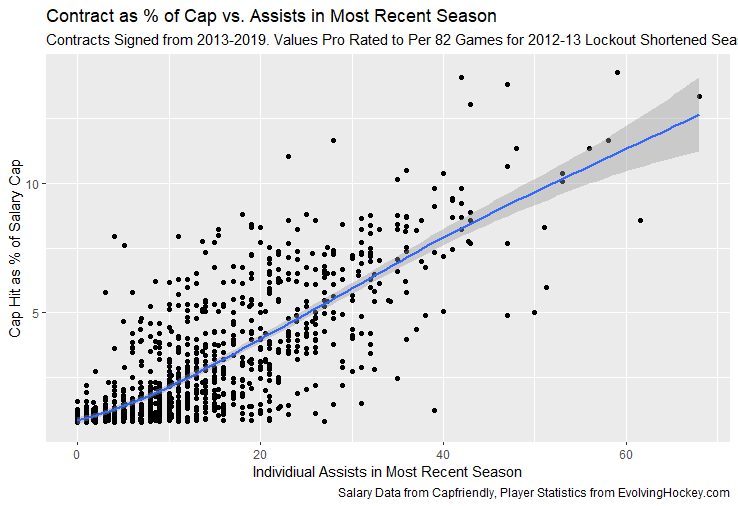
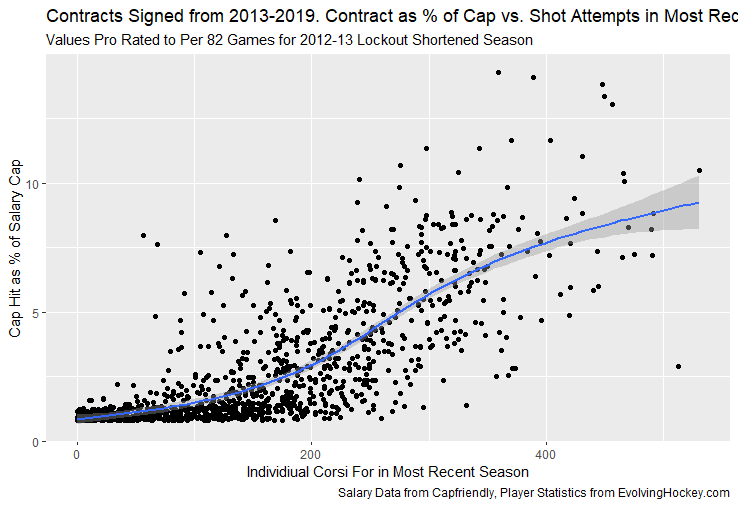
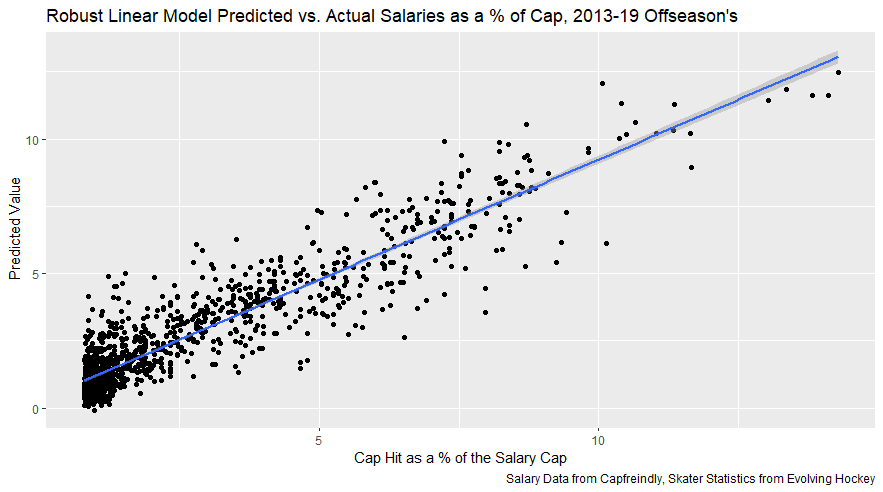
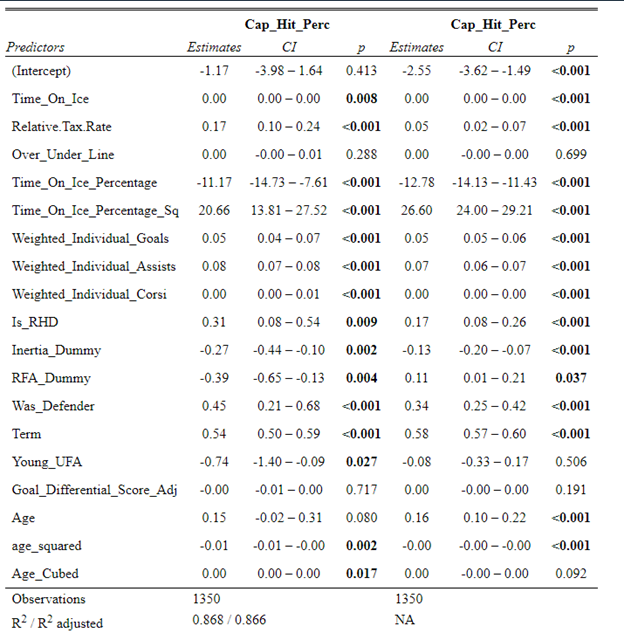
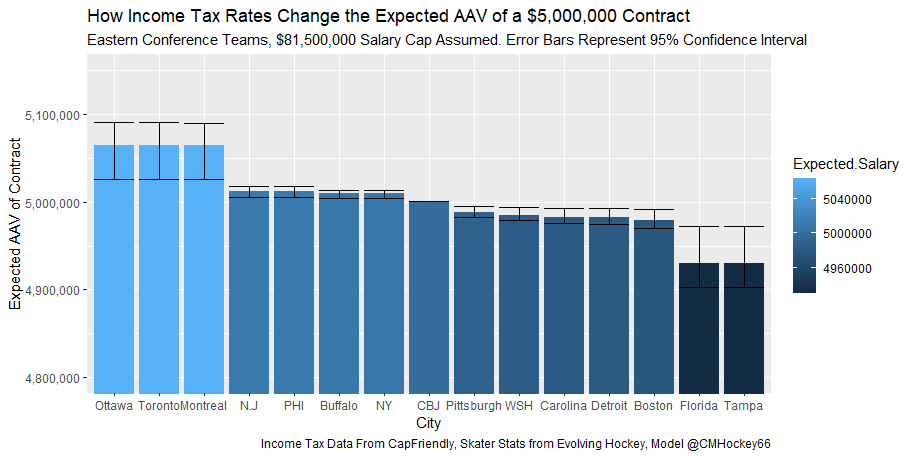
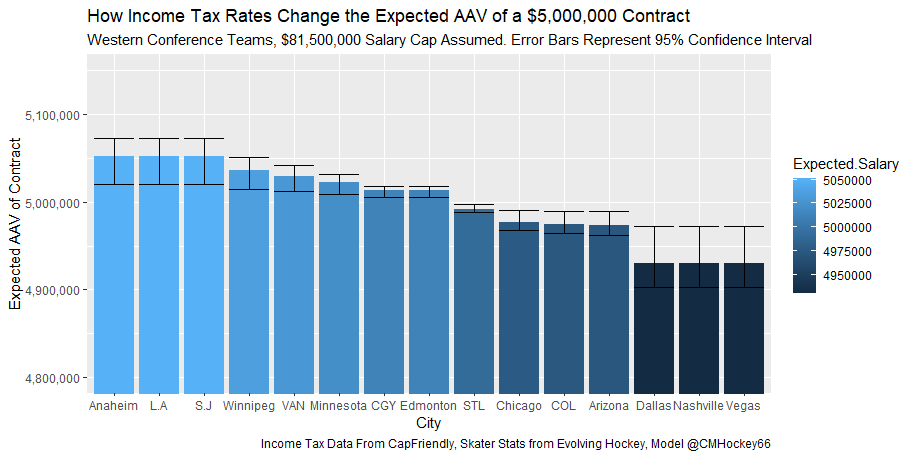
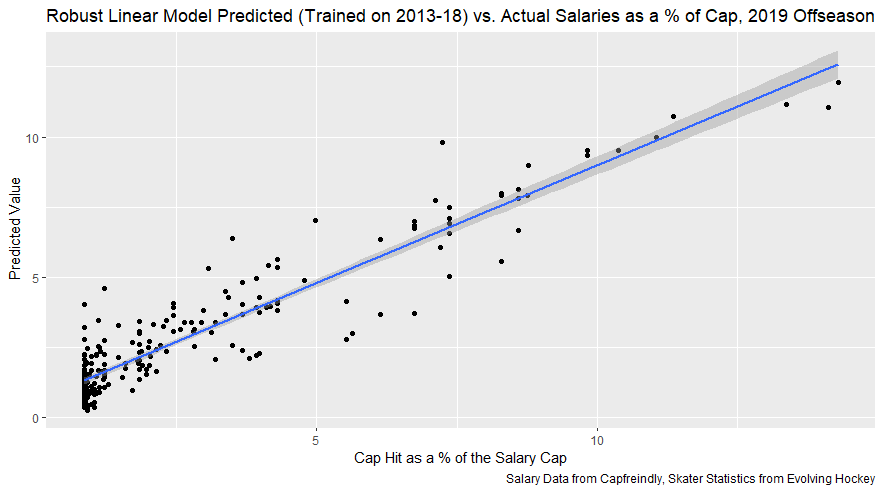
My 4th year project for school was about the marginal effect of income taxes on NHL salaries (with bonus content on inertia and the hometown discount). So, I wrote this post for 2 reasons. 1) Explain the findings of my project for those who are interest how taxes and the hometown discount affect NHL salaries in free agency, 2) Show and test my model of NHL salaries which I plan to reference in future posts probably at last word. Previous Work Predicting NHL Salaries My first idea for this project was pretty simple. Matt Cane and the Evolving Hockey Twins have produced great contract projection models in the past, They have taken various player statistics like points and time on ice to produce estimates of what players are going to make in free agency. Since they use player statistics but not things like tax rates and the "hometown discount" as variables, my idea was to look at their model's residuals. If the tax rate really was as important as people think and players were taking less money to sign in say Tampa Bay than Montreal on average, then Cane and the Twins models' errors should be positively correlated with the tax rate. That is players would tend to sign for above expectations in high tax cities, and below expectation in low tax cities. That is based on the simple assumption that the player's preferences will be revealed through their salaries. If player's dislike something, (i.e. paying high-income tax rates) they will tend to command more money when signing in high-income tax cities, and less money when signing with low-income tax teams, all else being equal. I don't believe this assumption will be controversial among sports analytics nerds. A field where people often must sacrifice a large part of their potential salary in another field just to have their dream job in sports. I wrote some posts using the data referenced above, but my Prof said this idea was a little too black boxy. Admittedly, looking at the residuals of 2 separate models, one of which isn't even public anymore (Cane's) is a little weird. Plus there were only 2 seasons of data at the time. So to increase the sample size and make it easier to interpret, I began building my own model of NHL salaries. Except for this time I was going to build variables like the tax rate right into the model. If taxes do affect NHL salaries, they should be a significant variable in the model alongside all the other variables we know influence salaries like points. So, time to build the model, but first a few notes about the data being used in this article as well as future articles on similar topics. If you're interested in what data was used to build the model and reach the conclusion, read below. If you're simply curious how you can expect players AAV's to change with the tax rate, you may want to scroll down to the results. Data There were some things that needed to be done to the data before I began my analysis, here's a list of the data sources and what data was included in the analysis. 1) All Salary, signing, and tax data will be from Capfriendly. 2) All the player statistics and information will be from Evolving Hockey. 3) I only used offseason contracts that were not extensions. Salaries were modeled as a function of the previous 2 seasons statistics. So, mid season contracts would present a problem. Also extensions signed a year ahead of time would be problematic, so they were removed. 4) Contracts were only included from the 2013-2019 off-season's. The first offseason under the new CBA was 2013, so that was the logical place to start. Then, since we were only part of the way through a super wonky offseason in 2020 when I began my analysis, 2019 was the logical place to end. 5) Since we began in 2013, this means the 2012-13 lockout shortened season data is in this post. To combat the shortened season, players statistics in that season were pro rated to per 82 games given the pace they were playing at currently. So if you played half the 48 game lockout shortened season, your stats were pro rated to playing 41 games. 6) I'm using 2 seasons worth of player statistics, so skaters had to be in the NHL for at least some part of each of the past 2 seasons to be included in the sample. 7) To weight the players statistics over the past two seasons, I used a 70/30 weight where the most recent season gets 70% of the weight. I experimented with a 65/35 weighting, however it made no difference. 7) Goalies will not be included. 8) Altogether, this leaves us with 1350 contracts to be analyzed for this post. 9) I keep saying "salaries" but what I really mean is AAV (average annual value of the contract) as a percentage of the salary cap to account for inflation. For an example of AAV as a percentage of the salary cap, take let's use 2019's biggest contract as an example. Artemi Panarin signed a 7 year contract worth $81,500,000. On average, that works out to $11,642,857 per season, that's his AAV. Divide his AAV by the salary cap at the time which was also $81,500,000, and we see Panarin's AAV as a % of the salary cap was about 14% ((11,642,857/81,500,000)*100) = 14.3. This 14.3 number will be the target variable of the analysis, not his actual salary in USD. 10) Canada and the United States have progressive income tax systems where people are taxed more the more they make. As a result a 45% income tax rate might be high for one player but low for another. To combat this, I used "relative income tax rate" based on Capfreindly's income tax rate calculator. Relative tax rate is simply the signing cities Z-Score of the league wide estimated income tax rate. For an example of "Relative income tax rate" imagine a $5,000,000 contract. The photo above shows capfriendly's income tax rate calculator around the NHL for a $5,000,000 contract. The league average income tax rate for this contract size is 46.55%, with a standard deviation of about 4%. When looking at the teams we see if a player were to sign with the Toronto Maple Leafs for this contract size, they would face an income tax rate of 52.96%. This is 1.67 standard deviations above league average ((52.96-46.55)/3.83) = 1.67. So, for this contract size, if the player signed with Toronto the relative income tax rate would be 1.67. This was done for every contract size in increments of $50,000, meaning for tax rate purposes the contracts were rounded to the nearest 50k. It is also worth noting that these values change slightly depending on what % of the contact is signing bonus. Since signing bonus changes year to year, the analysis assumes all contracts are paid entirely in salary. Building the Model That's all the assumptions and quirks about the data. Now to begin building the model. I begin with the Evolving Wild Twins work mentioned above. They showed how salaries are mostly a function of a few things. 1) Points 2) Shots 3) Time on Ice 4) The Term of the Contract Using on ice data from evolving hockey and salary data from Capfriendly, this holds up. All of these things have been strongly correlated with the salaries of contracts signed in the offseason from 2013-2019. None of these findings are particularly groundbreaking. The more goals a player scored, assists he had and shots he took, the more money he made, on average. Additionally the more minutes he played and the longer the contract, the larger the contract, on average. A few additional variables were added as well. Those variables being 1) Age, with a square and cube term to account for non-linearities 2) A positional dummy variable to account for the fact defensemen make less on average, but more holding output constant (since a 50 point defender is more rare than a 50 point forward, there are just fewer 50 point defensemen. 3) A handedness dummy variable to account for the relative lack of supply of right handed defenders. 4) An RFA dummy variable set equal to 1 for restricted free agents. 5) Score adjusted goal differential 6) The signing teams pre season over under line. It has been well documented recently that the good teams have disproportionately had low income tax rates (see Vegas, Tampa and Dallas making up 3 of the final 4 teams this year, and 3 of the 5 lowest tax teams in the NHL). So, to isolate the effect taxes have on salaries we need to hold expected team quality constant. To do this, I used the signing team's pre season betting market over under line was included to proxy team quality to avoid a potential omitted variable bias. (I got this data from hockey db). 7) A dummy variable for UFA's under the age of 25 8) The "inertia" dummy variable which I used as a proxy for hometown discount. This was a dummy variable set equal to one if the player signed his new contract with the same team he had been playing for for the entirety of the past 2 seasons. This is a less literal hometown discount than the players hometown since that data would be incredibly time consuming to collect. With the additional variables defined, it was time to put all these variable's into a linear regression model to predict AAV as a % of the salary cap. Note that the Twins discussed why linear regression isn't the best for predictions in their post, but it will help us estimate the marginal effect of the income tax rate on salaries, independent of all the variables above. Also it's worth noting I'm using a weighted OLS model based on the total size of the contract (AAV as a % of the cap multiplied by the length of the contract). This way larger contracts are weighted more heavily since a $10,000,000 contract probably contains a lot more information than a $700,00 contract. Additionally holding the size of the contract constant, the longer the contract the more heavily it was weighted in the model. Note all the regression results from here on out will be weighted by the total size of the contract in % of the cap terms. Before using these coefficients, a Breusch-Pagan test was done which revealed heteroskedasticity in the model, so the same coefficients were then run through a robust linear model to use for the final analysis. Results The robust model had a weighted R squared of about 0.8595. So, it turns out, about 86% of the variance in NHL AAV's can be explained with a fairly simple model using statistics that are easy to find on various hockey websites. Here are the final model's coefficients. (Focus on the right side since that is the robust model). How Taxes Effect NHL Salaries While a handful of the variables are interesting, let's start with the tax rate variable. Remember the target variable was AAV as a % of the salary cap, so interpreting the coefficients is a little more complex than raw dollars. If goals had a coefficient of 1 (that's "estimates" in the table above, CI represents that variables 95% confidence interval, while p shows that variables p-value) it would mean we expect players to make an additional 1% of the cap per goal scored. Using the robust model, we see a statistically significant relationship where a 1 standard deviation in the relative tax rate increased salaries by 5% of 1% of the cap, on average. I was extremely skeptical players responded to the income tax rate at all, and it appears I was wrong. That being said it has become incredibly common recently for people to explain away the success of low tax teams by saying of course they get all their players to sign for cheaper so they should be way better. In reality, the tax rate only accounts for a meaningful difference in salaries at the extremes. The 0.05 coefficient on tax rates is about $40,000 using today's salary cap. In the most extreme example, imagine a player who was expected to make $5,000,000 in a neutral tax environment, but he was choosing between Toronto and Tampa Bay. The model predicts he would sign for $5,068,053 in high tax Toronto and $4,934,800 in low tax Tampa Bay. That's only a difference of roughly $130,000. It is worth noting this difference is per contract, and teams are signing a handful of contracts per offseason. This means the tax advantage may eventually get up to 1 or 2 million for teams like Tampa Bay. In a world where like half the NHL has been over the cap at some point this summer, this is a meaningful competitive advantage for the low tax teams, but that's specifically over their highest tax rivals like Toronto and Montreal. Picking two teams closer together on the tax spectrum, imagine Columbus (as close to tax neutral as possible) and Arizona (on the lower end) competing in the same scenario. The model would predict that player to sign for $4,995,925 in Columbus and $4,972,697 in Arizona. That difference probably means something to the player and their family, but it means very little in the grand scheme of the NHL. League-wide, again assume some player is expected to sign for $5,000,000 on a neutral tax team. This graph shows how large we expect that contract to be around the entire NHL. (It's hard to fit that much data on one graph so they are broken down by conference). So yes, it looks like taxes almost certainly do affect NHL salaries. Low tax teams can expect to sign their players for slightly cheaper, giving them a competitive advantage over the high tax teams. That being said, the difference tends to be incredibly small, often less than $100,000 in a league with a salary cap of $81,500,000 right now. So be super skeptical of arguments that tax rates are the reason for anything other than slight salary differences across the NHL. Taxes may help or hurt your favorite team's GM, but they are certainly not the cause of all their contract problems. Evidence of the Hometown Discount in the NHL The other coefficient of interest is the inertia dummy variable as a proxy for the hometown discount. Humans tend to hate change, and NHL players get made fun of for staying put more often than other athletes all the time. That being said I do have some sympathy for why people would want to stay where they are, and therefore generally take less money to stay put. NHL players are already millionaires, so say you have some good friends in the room, or your kid just met some great friends at school after you've moved your family around their whole life, why not take a smaller salary to stay where you are? Whatever the reason, it appears although NHL players generally prefer to stay where they are. Holding all the variables above constant, when a player has signed with the team they exclusively played for each of the past 2 seasons, that contract tends to be about 0.0013% of the cap smaller than it would be with any other team. Using today's salary cap, this means players tend to sign for about $100,000 less to stay put, on average. While this is not a massive amount, it is just another incentive for teams to draft their stars rather than acquire them through trade or free agency, because they can expect to sign them for slightly cheaper when it's time to negotiate. Do Better Teams Get Players Cheaper? The final interesting coefficient which I looked at here was the signing team's pre-season over under line. If players prefer to play with better teams, we would expect to see a significant negative coefficient here. That is not the case. While some individuals have certainly signed for less money to be on a contender, general statements like the better the team the cheaper they get to sign their players appear to be fetched. Either way, as mentioned above, this does act as an important control variable for the rest of the coefficients. Predictive Value of the Model Before finishing up this post, I wanted to touch on how this model performed in out of sample forecasts. To examine its out of sample accuracy, I removed the 2019 offseason to make a training dataset, leaving the 2019 offseason as the test dataset. Here is how the model faired when predicting 2019's AAV's. The original 0.86 R squared improved when looking at out of sample data. The out of sample R squared was 0.8986, meaning the training model explained about 90% of the variance in the out of sample data. For additional context, the mean absolute error was about 0.69 (after hand adjusting so the model doesn't predict players to sign for less than league min this dropped to 0.65). This means the out of sample predictions were off by about $530,000, on average. So, this super simple model has some predictive value too.
1 Comment
|
AuthorChace- Shooters Shoot Archives
November 2021
Categories |
 RSS Feed
