|
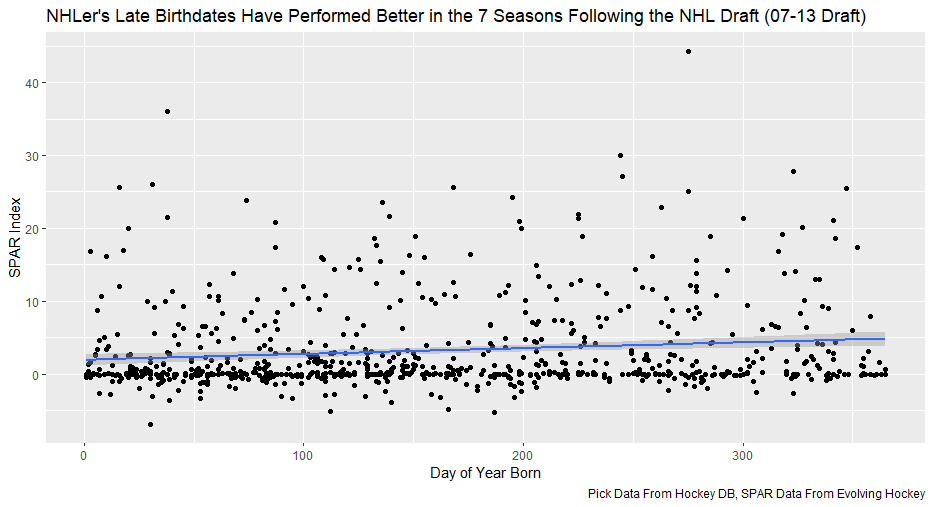
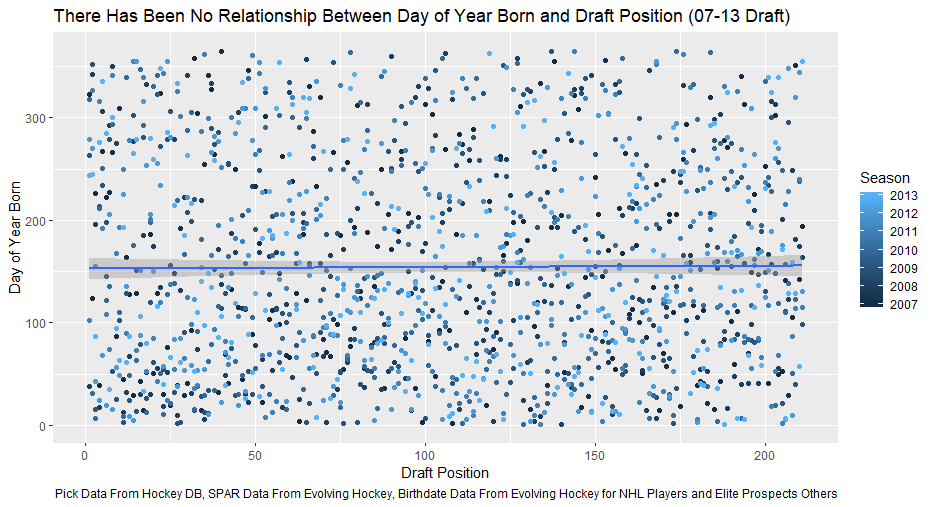
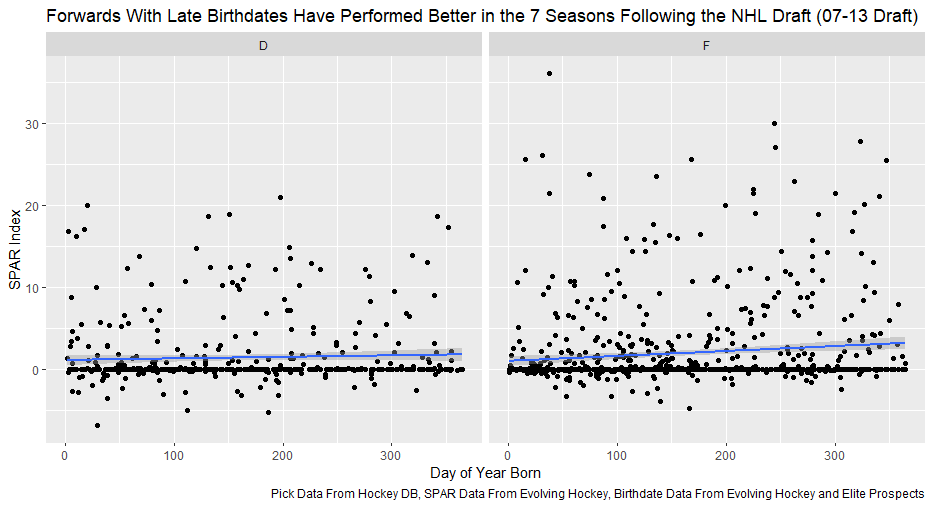
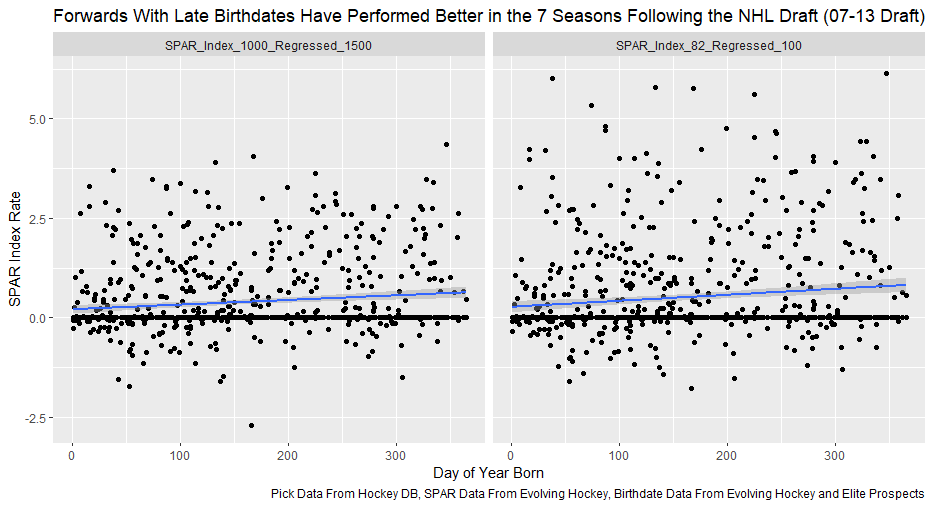
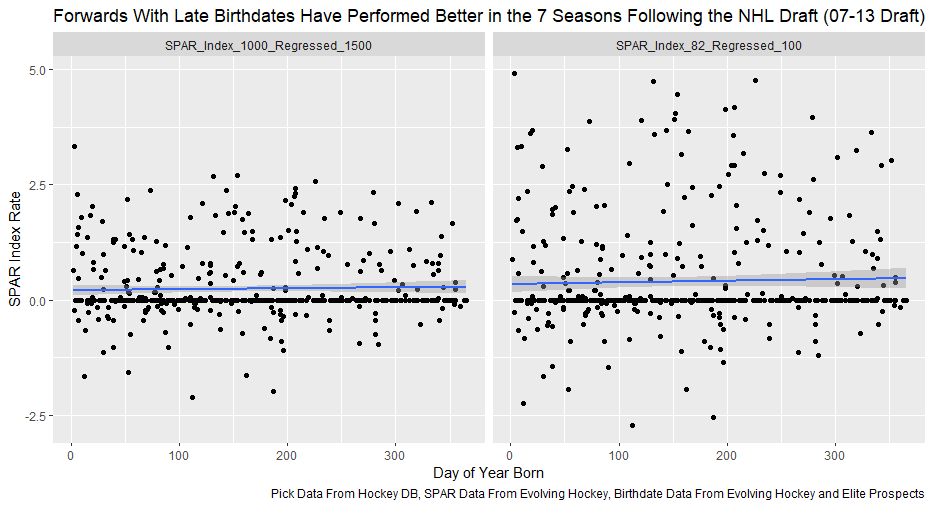
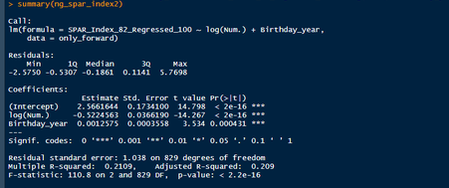
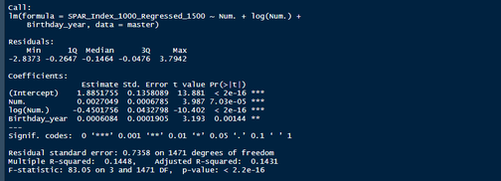
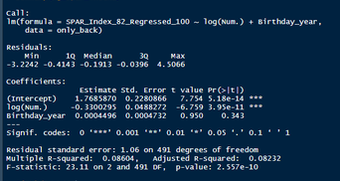
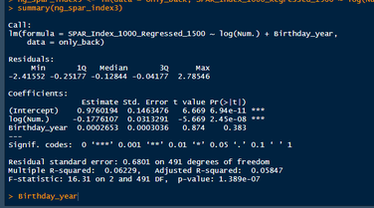
Nerds like me tend to fetishize “market inefficiencies”. That hidden pattern showing the conventional wisdom is wrong. Suggesting there is an edge to be gained with some trick. In hockey, these market inefficiencies are likely most valuable at the NHL draft because of the NHL’s entry level and RFA contract systems allowing teams to underpay top talent if they drafted it for at least 7 seasons. This post will explore a relatively old topic that has been a market inefficiency at the NHL draft in past few seasons, drafting players with later birthdays (in a given year, so December 15th as opposed to January 15). It is easy to see how players with later birthdays might become undervalued by scouts. Humans usually treat age like an integer (18, 19, 20 etc.) when in reality it is a continuous variable (you can be 17.69 years old). It is easy to see how this may lead players with later birthdays to be undervalued. Imagine two 17-year-old prospects, however one is born in mid January, while the other is born in mid December. At age 17, the January born prospect is about 5% older than the December born prospect. That is 5% more time to train with skills coaches, play, workout etc. (Obviously even more than 5% because babies are not working out). All else being equal this ~5% edge means the January born player should be better at hockey when both prospects are "17". What % of this edge is due to the older player being a better prospect, and what % is due to the advanced age of the January prospect can be difficult to discern. If scouts are not careful it can lead to the December born player being undervalued because the gap between him and his peer is a result of age, not being an inferior prospect. This potential bias likely explains (at least in part) some peculiar patterns in recent NHL draft history. Using drafts from 2007-2013, drafted players with later birthdates have outperformed picks with relatively early birthdays in the 7 seasons following the players being drafted. If you plot drafted players who have made the NHL’s output over that time against their birthdate in the year (so 1 is born on January 1st) there is an obvious upward trend in output as birthdate increases. (Note this post is using Standing Points Above Replacement (SPAR) data from Evolving Hockey to define “output”. I call the metric being used SPAR Index because it takes the average of each players Standing Points Above Replacement and Expected Standing Points Above Replacement) The upward trend shows that, among draft picks who have made the NHL, those born later in the year have outperformed prospects born earlier in the year in the 7 seasons following their NHL drafts. An NHL player who was drafted in December has on averaged, outperformed a player drafted in mid December by about 2.6 standing points above replacement index in the 7 seasons following the draft, on average. This may sound like a small margin, but it is more than one win above replacement. Given the obscene amounts of money teams pay for single wins on July 1st, it is far from insignificant. This relationship is also not likely a result of draft position and therefor perceived prospect quality either, because day of year born is not related to draft position. Age Bias By Position The relationship between birthdate and output is not equal among all positional groups either. I expected defensive prospects to be most miss valued due to the relative age effect. Defence is generally considered to be the more physical position. So, i figured having less time to develop physically would disproportionately hurt defenders. When looking at the data, the opposite is true? There is an upward trend where player output increases with birthdate among forwards, but not defencemen. (The upward trend exists for goalies too, but there is not enough data for it too be meaningful). So, it turns out only forwards with relatively late birthdays have been undervalued. The relationship only holds among the entire sample because over 55% of NHL draft picks were forwards from 2007-2013. While we have only looked at cumulative output in the 7-year period following the players NHL draft’s so far, we can see the relationship’s from above have not been a result of changing opportunity either. This is clear because when we look at per game and per hour output, we still see the same pattern. Forwards with late birthdays outperform forwards with early birthdays on a per game and per hour basis, while defenders do not. (The SPAR_Index_82_Regressed_100 variable represents SPAR_Index per 82 games played, while SPAR_Index_1000_Regressed_1500 represents SPAR Index per 1000 minutes of time on ice. To control for outliers who produce extremely well or poorly in small samples these numbers have been regressed towards replacement level. The per 82 game metrics was regressed towards replacement level up to players 100 game mark, while the per 1000-minute metric was regressed towards replacement level up to 1500 minutes. So, if a player produced 1 SPAR index in 14 games and 140 minutes, rather than a per 82 game output of 5.85, this analysis assumes the player was a replacement level producer for the remaining 86 games. This pulls their per 82 game output down from an inflated 5.85 to 0.82. The same process was done up to 1500 minutes for the per 1000 minutes data. The endpoints matter here and were selected by me, so it is worth noting everything I am about to mention applies when regressed to replacement level up to 50 games played and 750 minutes played too). The next graph shows the same metrics, but no trend for defenders. No matter what metric is used, per minute output, per game output, or cumulative output in the players 7 seasons following their draft, forwards born later in the year have been better than those born earlier in the year, and defenders have not. At least not by enough that the difference is meaningful. Even when running a regression to hold draft position constant, being born later in the year has a statistically significant increase in player output. (Using the idea from Dawson Sprigings Draft pick value article of a logarithmic trendline to account for the nonlinearity in pick value. However, the same relationship does not exist for defenders. If teams were drafting without biases over a decent sample, no meaningful correlation would exist between player output and any variable other variable when draft position is being held constant because players draft position should include all valuable information available at the time . And yet something as simple as birthate is highly correlated with output even after accounting for draft position. The effect is so dramatic that independent of draft position, a 330 day increase in birthdate within a year has corresponded to an additional 0.41 Standing Points above replacement index per 82 games, plus or minus 0.117 SPAR index. This relationship tells us teams have been systematically undervaluing the effect of forwards birthdates at the NHL draft. They have been too harsh on younger forwards and too high on older forwards.
Adjusting for relative age can be a very difficult thing to do. The most recent run of NHL drafts that have players we can analyze shows this. As a result, NHL teams may be able to draft better simply by adjusting for birthdates differently than they have in the past. By selecting players with late birthdates earlier than market has previously suggested they should, your favorite team may have an edge when the 2020 NHL draft rolls around.
0 Comments
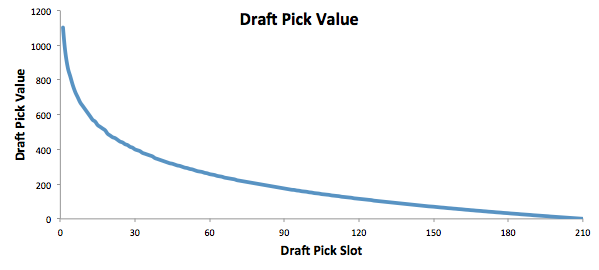
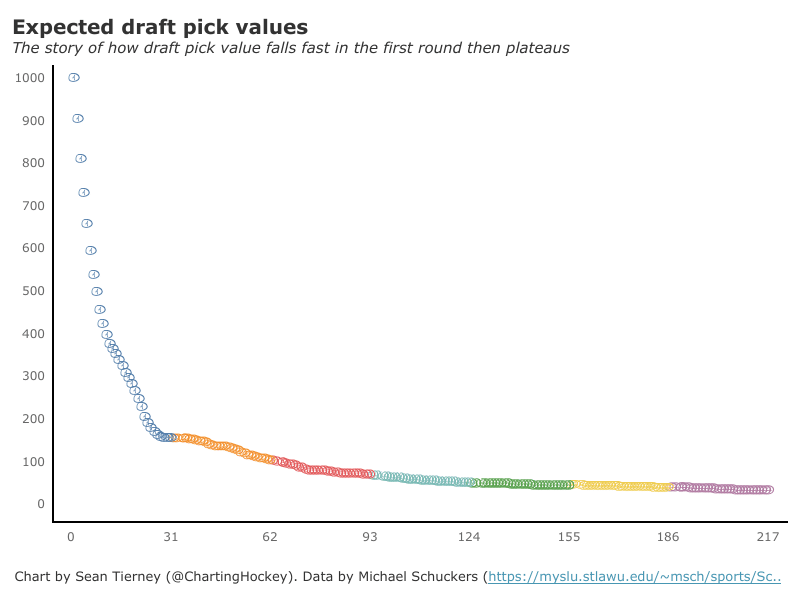
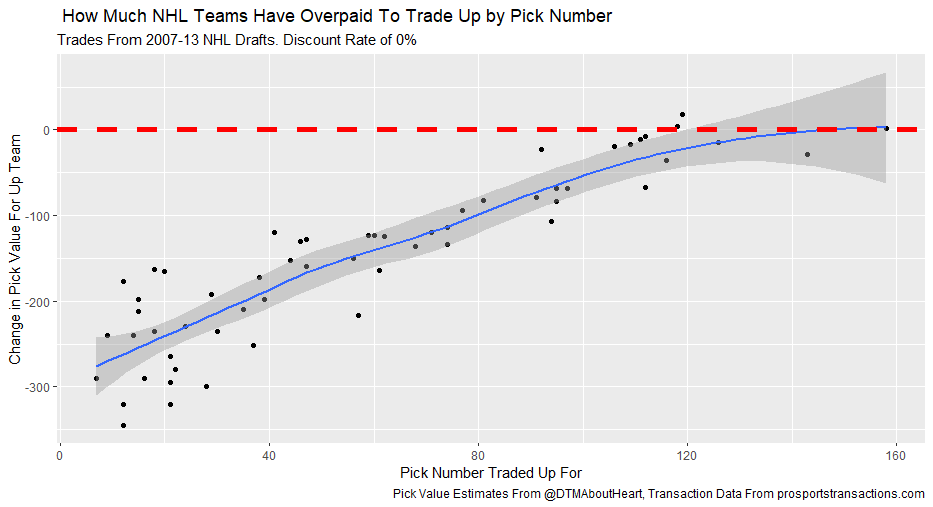
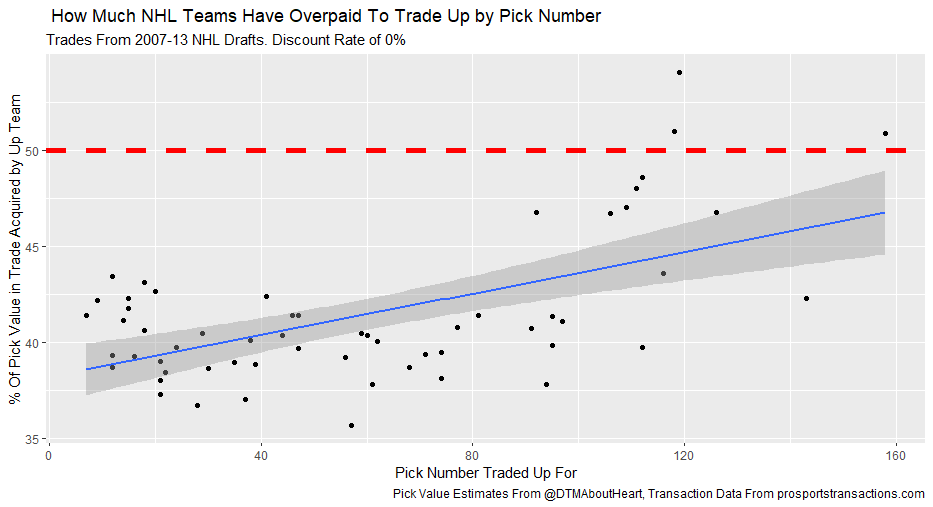
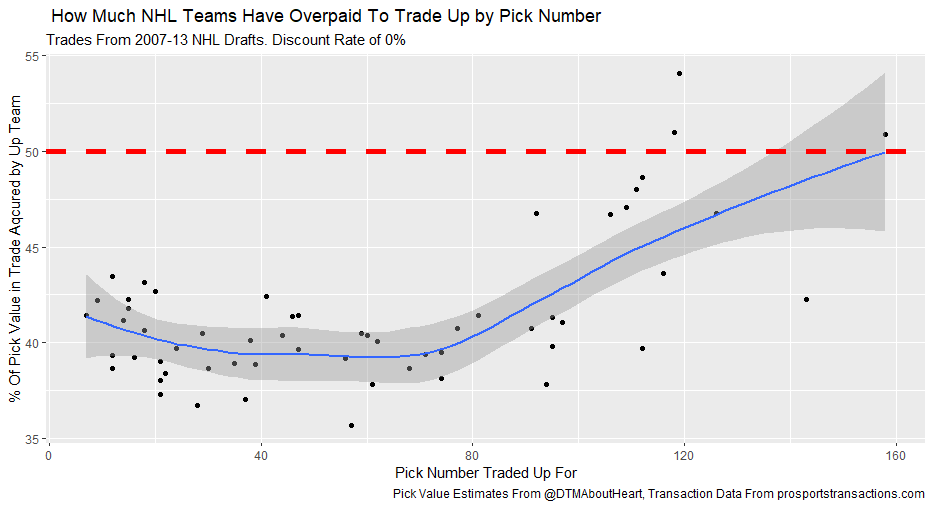
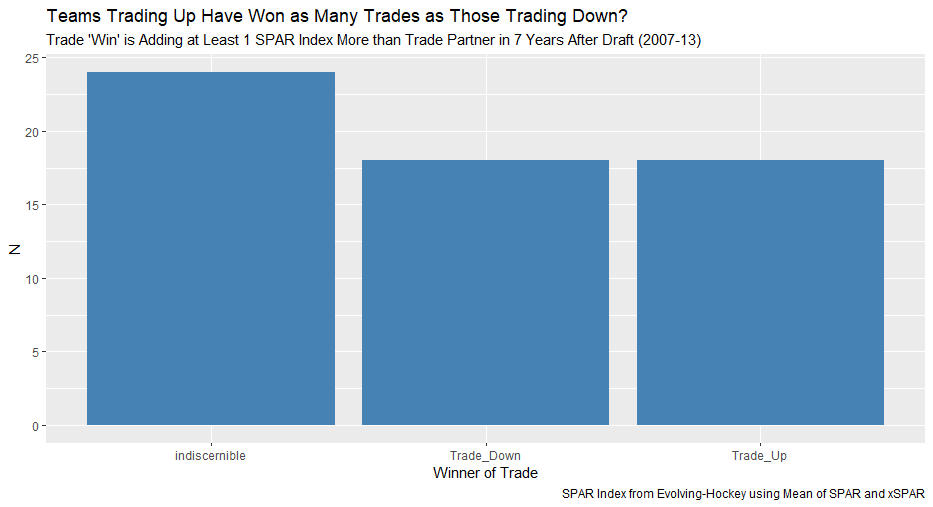
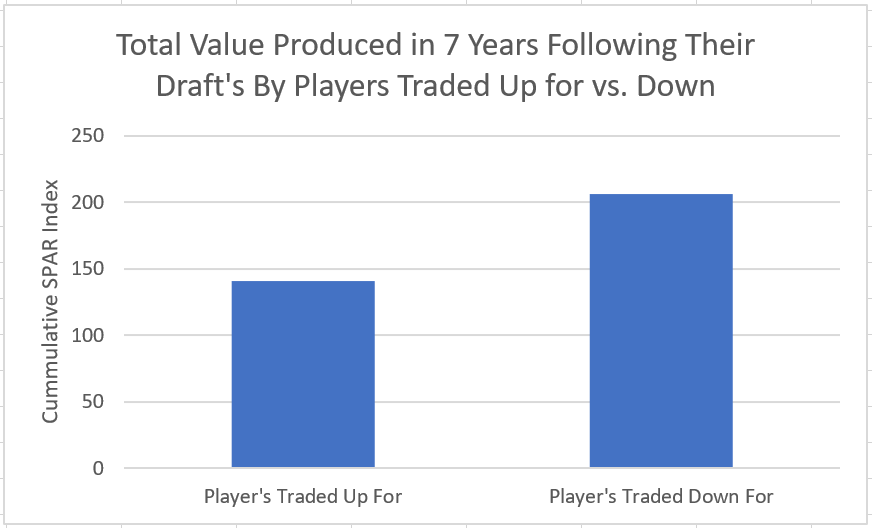
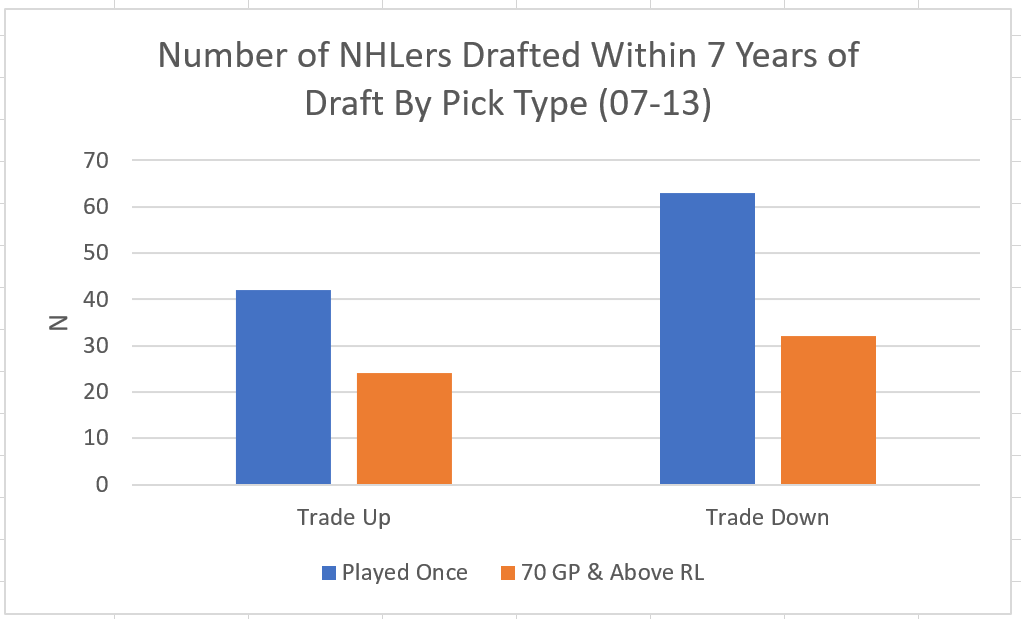
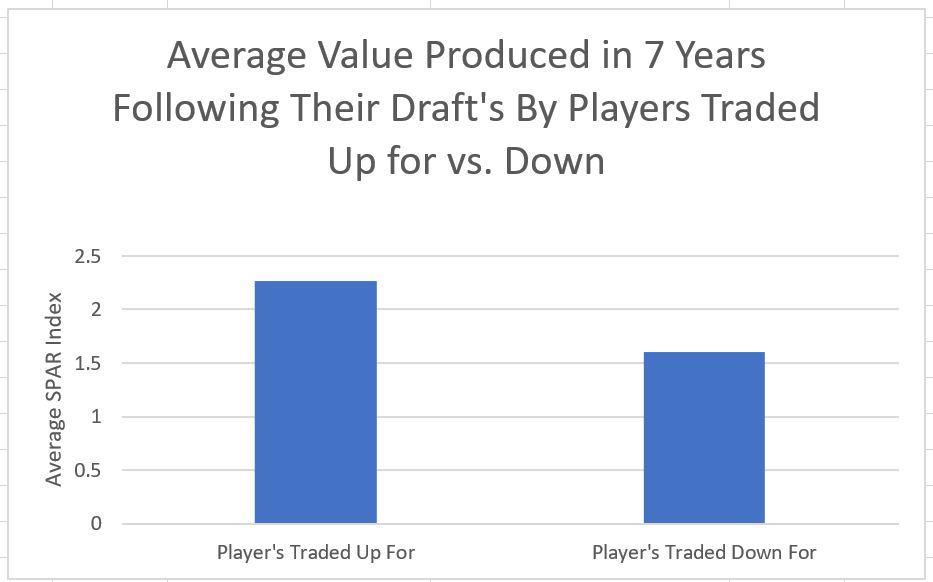
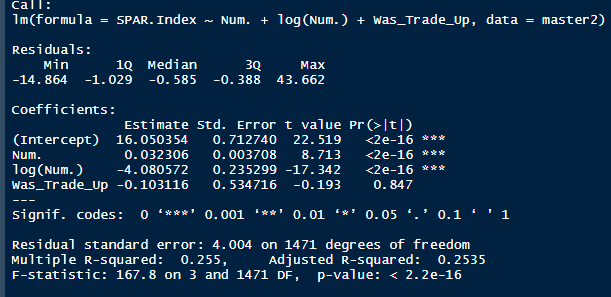
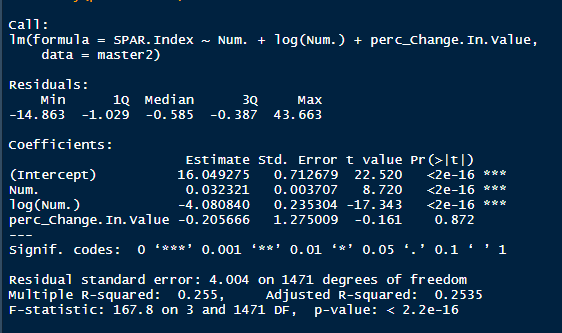
I'm not sure when the 2020 NHL draft is going to be, but as it approaches there is one thing I am sure of. Everyone on Twitter who has ever used a spreadsheet will be ready to explain the virtues of trading down. The theory usually starts with a draft pick value chart looking something like these. (DTM's is first, Shuckers is second) Based on work by smart people who have quantified the value of each NHL draft slot, the thinking goes like this. The value of a given draft pick falls off very quickly after the top few picks. After those top picks, a pick in say the fourth round is not much worse than a pick in the third round. As a result, teams are better off prioritizing quantity above quality. For example using both of the charts above, you would be better off, on average, with the picks in the middle of the third and fourth round than one pick in the middle of the second, even though the asset "second round pick" is often perceived as very valuable. Therefor the smart teams will be the one's trading down for additional picks, preying on the less enlightened teams who are fixated on an individual player. Of course the easiest rebuttal to this argument is it lacks context about the individual draft and the player's available at a given pick. After all, the Senators did trade up for Erik Karlsson's pick, how can this have been a bad decision? So while trading up may be dumb on paper, giving up value to move up can be worth it when you think there is a steal on the board. This is presumably the reason everybody knows trading down is smart in theory, and yet teams trade up all the time. I was skeptical of this augment because it involves being smarter than everyone else consistently to be a viable long run strategy, but, I honestly didn't know how successful trading up has been. So i figured why not compare the outcomes of teams who have traded up to their counterparts who moved down. To shed some light on this subject, I began by collecting data. I took every trade from the 2007- 2013 drafts involving only picks and looked at the player's outcomes in terms of Evolving Hockey's standing points above replacement over the next 7 NHL seasons to see which teams won more of the trades. Was it generally the teams moving up or down who ended up with more value? Note 7 seasons was chosen because drafting a player gets you their rights for 7 seasons. This analysis only uses the 7 seasons following the draft rather than the player's first 7 seasons to help combat the lack of data already apparent in this exercise. The number of pure pick swaps in the sample is 60. It would be higher but many pick swaps include players. Since we cannot know how much value is being placed on the player's in the deal relative to the picks, any player being involved meant the deal was not included. Also note I refer to standing points above replacement (SPAR) "index" because I simply took standings points above replacement and expected standing points above replacement, added them together and divided by 2. Trading Up Is Expected to Fail (at least the way teams have been doing it) Although to start, I should point out that teams who traded up have over-payed to do so. Using DTM's draft pick value chart we can see not only have teams almost always lost value when they traded up (only 4 of 60 trades produced positive expected value for the team trading up), but they lost the most value when trading up for higher picks. Of course the pick values are meaningless here, so here is an example. DTM estimates the 20th overall pick is worth 480 points of value. To trade up for that 20th overall pick, teams generally give up 480 points of value plus 250 points of pick value. This loss of 250 pick value points means teams have over-payed for pick 20 by an early third round pick ( #62 or 63 overall), on average. To contrast this, teams who moved up for the 80th overall pick have traded 200 points of value (covering the cost of the 80th overall pick) and then added about 100 points of expected value. Meaning teams have over-payed for pick 80 by about a mid 5th round pick (129 or 130 overall). By the 5th and 6th rounds, teams who traded up barley lost any expected value on average, but since most pick for pick trade ups were for earlier picks, the teams who moved up still usually acquired far less expected value than those moving down. I should note this does not necessarily mean NHL teams over valued those early picks most (although that probably explains a part of it) there is also the fact that it is difficult to overpay for something worth next to nothing. When we look at the % of trade value acquired by the team moving up, we see teams did tend to receive a higher percentage of the overall draft pick value changing hands when trading up for a low pick relative teams who traded up for first and second rounders, but the relationship is not as robust. Side note, the type of trend line I choose can make the argument look a lot different with the same data. With this trend line on the same graph I could easily argue teams grossly over valued early picks (roughly 1-80) relative to later picks when trading up. Maybe teams over value high picks (1-80ish) most relative to public estimates, maybe there isn't enough data on pure pick swaps in the later rounds, or some combination of the two explains the random slope change. I'll leave that up to your interpretation. Either way teams moving down have given up generally lose expected value to do so, suggesting the team trading up should generally have worse outcomes than those moving down, but has this actually been the case? Winners and Losers of Trading Up When evaluating the outcomes the original results shocked me. My first though was to examine who "won" most of the trades, those who traded up or those who traded down? I defined a trade "win" by a team adding at least 1 standing point above replacement index more than the team they traded with. Teams had to win by at least one standing point to account for the fact our estimates of player output are not perfect. If the Leafs and Habs traded, and the Leafs acquired 7.5 SPAR while the Habs acquired 7.6 SPAR, it would be unreasonable to conclude the Habs "won" the trade because there are error bars in the player evaluation metrics. As a result, deals where trading teams drafted within 1 SPAR index of one another were counted as indiscernible rather than a win for either team. I also made it so teams could not "win" a trade because the other team picked a player who was below replacement level for a long time. Say team A got 0 SPAR, while team B got -4 SPAR, using my methods neither team "won" this trade. Such a deal would go in the indiscernible category. With that defined as a trade win, the results threw me off. Turns out the most common outcome is neither team winning, but the teams who traded up have "won" just as many of the trades as those who moved down. Unfortunately this is where the good news about teams who moved up stops. All trade "wins" are not created equal. So, If we look at the cumulative value acquired by those who moved up and moved down, we begin paint a much more damning picture of trading up. Teams who have moved down have acquired far more cumulative value than those who traded up in the 7 years following the draft. It is roughly a 60/40 split in terms of total value drafted (This is assuming Viktor Arvidsson produces at his career average pace over his average number of games played next season). Note that teams who traded down also produced more NHL players, not just more quality NHL players. The reason teams who moved down drafted better was by taking advantage of the quantity > quality mindset. This becomes obvious when looking at the average value of players who were traded up for vs. down. The players teams have traded up to get actually produced more on average than those acquired by trading down, But because the teams trading down had 129 darts to throw while the teams who traded up only had 62, the teams moving down still got far more total value and NHL players. Before finishing up, I had two additional theories that may teams who moved up are smarter than we give them them credit for, so I decided to test them too. The first was that while teams who move up generally lose the deal, they are at least ahead of the pack in one area, player evaluation (evaluating the specific player they trade up for anyways). We saw that players teams trade up for produced more value on average than their counterparts. I wanted to test if this is simply because of the higher draft slots used on trade ups, or if players who are traded up for tend to outperform their draft position. If the dummy variable "was traded up" set equal to one if a team traded up for a player and 0 otherwise was a significant predictor of player quality independent of draft position, it would suggest teams who trade up were are at least generally getting players more valuable than their draft position implies. This was not the case. Independent of draft position, player's who are traded up for have actually produced slightly less value? however not by enough to suggest this is anything but noise. Finally, I wanted to test drew back on something pointed out above. Teams have tended to overpay most for early picks, specifically before pick 80. I wanted to test if there was any relationship between how much draft capital teams gave up for a player and how good the player became. My thinking was the more teams gave up to pick a player, the more confident they must be in his abilities. The more confident a team was in a players abilities, the better that player should have been. Even if teams are more confident in a player's abilities based on how much they gave up for him, it has not translated to higher output once in the NHL.
I set out to evaluate trading up based on outcomes rather than process. Not only does a "process" oriented mindset supports trading down, but the results have favored trading down too. In sum there are a few key takeaways from this post. 1) Teams have grossly over-payed to trade up, and over-payed most for high draft picks (roughly 1-80) 2) Teams who traded up tended to get a more value per player, but this is because they are drafting with higher picks, not because of awesome foresight causing teams who moved up to draft players better than their pick number implies. 3) While teams who trade down get less value on a per pick basis, they get so many more shots to find talent that they who drafted more NHL players, and more good NHL players than their counterparts. 4) The more teams have been willing to give up to trade up might signal more confidence in that player's abilities, but that confidence hasn't translated to more production either. 5) Trading Down is great in theory, and has worked well in practice. So if teams are willing to overpay to move up, don't hesitate and trade down! Thanks for reading! Also, thanks to evolving hockey for the player statistics at the NHL level, hockey db for player pick numbers, and prosportstransactions for the pick swaps data. |
AuthorChace- Shooters Shoot Archives
November 2021
Categories |
 RSS Feed
